
The Pectra Upgrade in Numbers from the P2P Network
These are our main takeaways:
Hard-forks are pivotal moments that redefine the capabilities and efficiency of the network. On May 7th, Ethereum Mainnet upgraded from the Deneb to the Electra fork which included a few critical changes and improvements to the consensus and networking layers of the protocol. In this post, we specifically look into how the network has prepared for the fork by analysing the network topology in the weeks leading up to the event, how message arrival times have changed, and if the upgrade enabled some relaxed bandwidth requirements.
For this, we have conducted a dedicated analysis of the data that some of our measurement tools like Nebula and Hermes have gathered before, during and after the hard fork event. This analysis complements our weekly updates on the network topology, block arrival times, bandwidth usage, and more. We have done A Deep Dive into the P2P Layer of the Dencun Hardfork a year ago which informed some of our focus areas for this study.
For the work presented in this post, the ProbeLab team made use of the following tools
The results presented in this study span a period of two weeks: one week before the Pectra upgrade (i.e., dates: 2025-04-28 to 2025-05-07), and one week after (i.e., dates 2025-05-07 to 2025-05-14).
In the later "Hardfork impact on block arrival times" section of the report, we reference Xatu’s public database, which aggregates data samples from a diverse set of agents and nodes participating in the Community Data Collection Effort. This includes:
Data for the rest of the sections came from our continuous Nebula crawler deployment, plus custom scripts wherever it was needed.

The above graph shows the advertised fork digests in the discv5 DHT around the time of the hard fork. One can clearly see a sharp drop of advertised Deneb digests at the hard fork time: 2h after the hard fork, 70% of nodes followed the new fork. In the days following the hard fork there is a long tail of nodes updating to the new fork. However, five days after the fork there are still around 12% of nodes following the outdated fork. We can safely assume that these nodes don’t run validators, as otherwise, they couldn’t follow up with the head of the chain, which ultimately makes the validator unable to perform its duties.
One could assume that the nodes which didn’t upgrade on time are home/hobby deployments. However, if we split the online nodes five days after the fork in two categories 1) follows electra 2) does not follow electra, we can see that nodes who don’t follow electra predominantly run in cloud infrastructure - cancelling the hypothesis of home deployments.

Looking at the next fork versions that nodes announce, we can see that some clients already advertise the next Fulu fork.

Interestingly, this is almost exclusively Prysm that already announces Fulu here. The other client implementations still only publish Electra.
Looking at the days leading up to the hard fork, we focus on how users of the Prysm, Lighthouse and Teku implementations adapted compatible client versions.
The following graphs show the number of nodes running a certain version of one of the mentioned client implementations over time until a few days after the hard fork. All three graphs denote the time at which the hard fork happened as well as when the first compatible version for the new fork was released on GitHub.

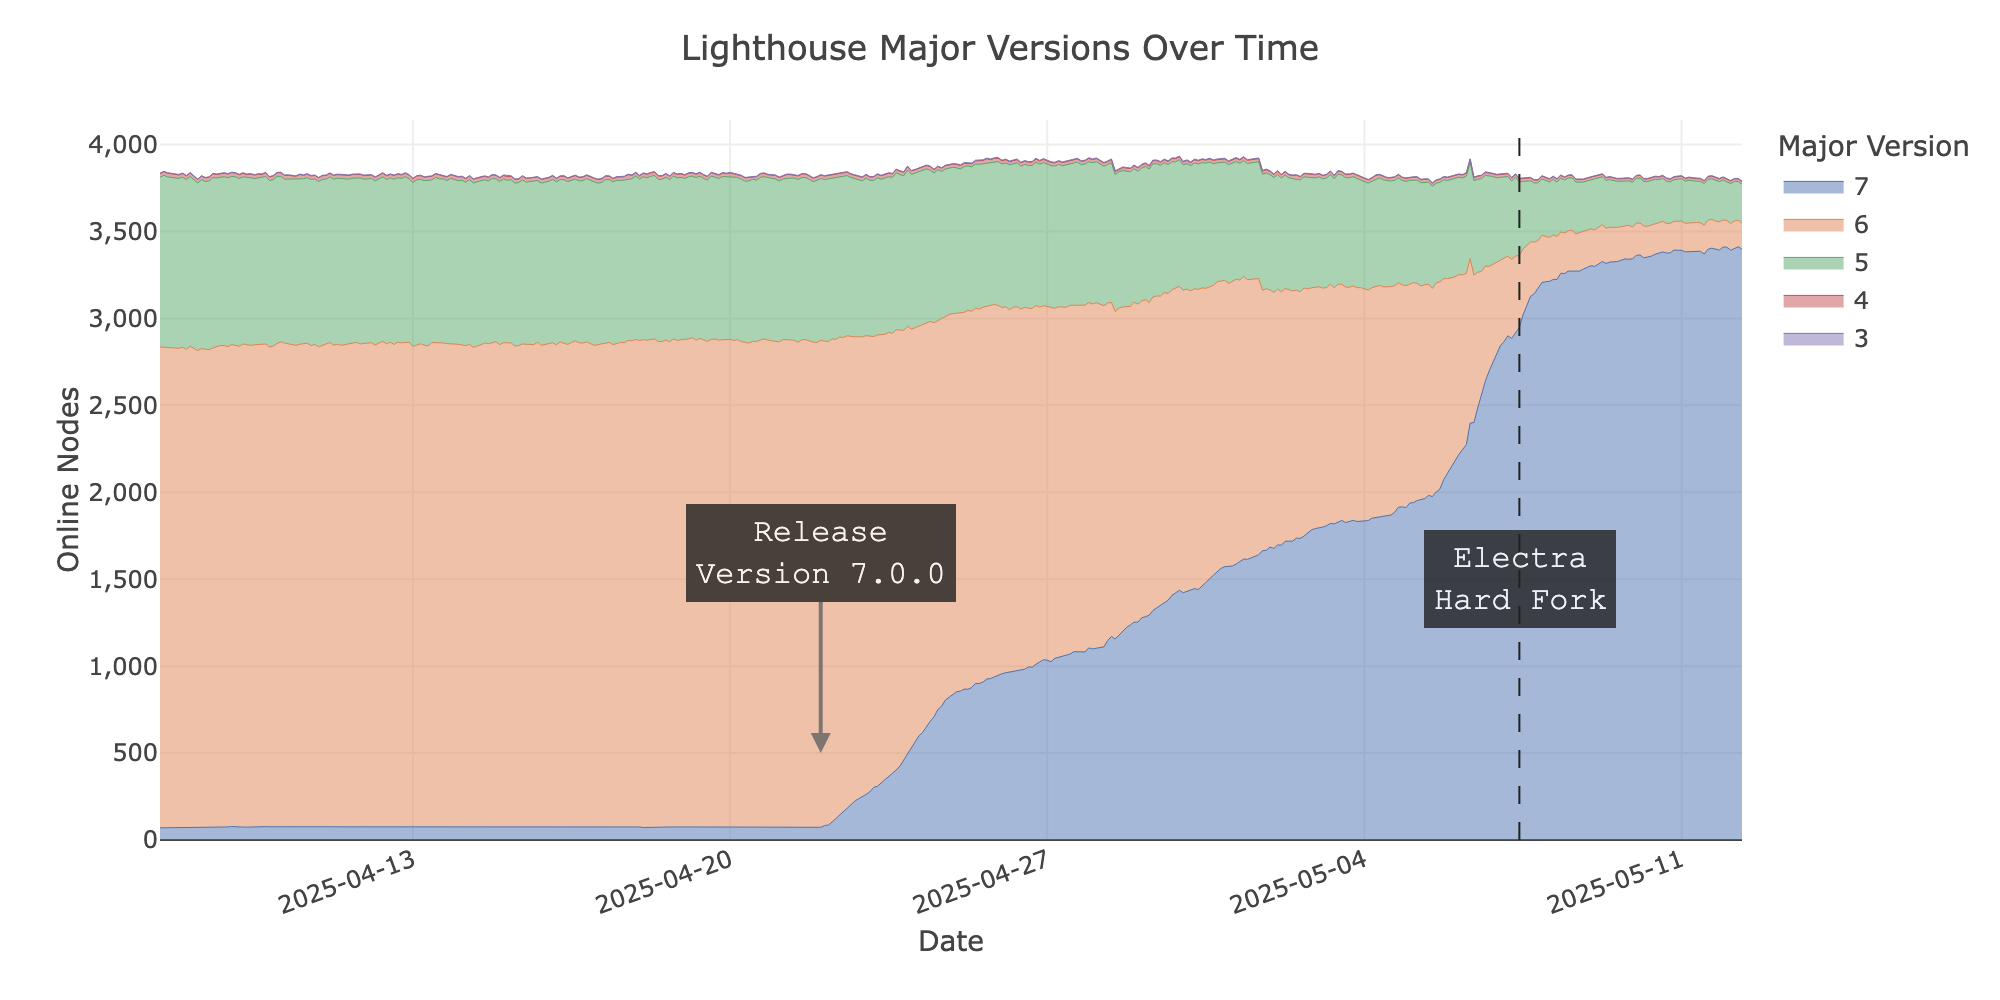

As expected, in all three cases, we can see that shortly after an official release of the respective client, node operators started to upgrade. Two days before the hard fork around 53% of the nodes in the network were running an Electra-compatible client implementation - 60% one day before, 67% one hour before. The numbers don’t consider Nimbus clients as they don’t advertise version information. Nimbus is the fourth implementation with a significant share in network deployments, so the number of Electra-ready nodes is likely a few single-digit percentage points higher.
We can also safely say, that node operators don’t use the hard fork as an opportunity to switch client implementations as the following graph shows. The distribution of client implementations hardly changed during the fork.

One of the core additions of the Pectra upgrade is the increase of the blob target and max values by three extra blobs per block (see EthPandaOps post, ProbeLab post). Despite the fact that the network benefits by that extra 50% of ephemeral space, this blob count increase also means that the network needs to transfer up to 348KBs extra data in every slot. This ultimately could have an impact on the overall message broadcasting capabilities of the network, if nodes can’t allocate more bandwidth at the early stages of the slot, when the block gets propagated.
The following graphs were aggregated by fetching all the block arrival times submitted to the EthPandaOps public Xatu instance. Note that the first chart belongs to the measurements before the Pectra upgrade, and the second one after the upgrade. This data includes not only data points from the Ethereum Foundation’s sentry nodes, but also from some external collaborators that participate in the community data collection program. For more clarity, the graphs describing the pre-Pectra state span the dates 2025-04-28 to 2025-05-07, while the ones post-Pectra span the dates 2025-05-07 to 2025-05-14. Furthermore, for the sake of a cleaner distribution, we’ve dropped all those block arrivals that exceeded 12 seconds since the beginning of the slot where they were proposed. We consider that a block arrival that exceeds the 12-second mark is likely to be related to a reorg rather than to the gossipsub message broadcast that we are trying to visualise.
The following graphs show the block arrival time using the start of the slot, or t=0, as reference. The first graph focuses on data before the Pectra upgrade. The graph shows similar distributions across the different countries, with the total mean of block arriving at the 2.386 seconds mark before Pectra. It is worth mentioning, though, that we do measure a spread of 500ms between the fastest receiving continent’s mean (Europe with 2.278 seconds) and the slowest one (Southern America with 2.725). Furthermore, the figure also shows that 95% of the data points were received within the 3.84 seconds of the slot, respecting the spec window of 4 seconds for the block propagation. However, this is not the case for all countries; nodes placed in Africa and South America had their 95th percentile of block arrivals exceeding the 4-second mark: at 4.327 and 4238 seconds marks, respectively.
Before Pectra:

After Pectra:

The second graph shows distribution of block arrivals after the Pectra upgrade. We observe that the aggregated mean distribution (not the division by continent) improved by 56ms at the 2.33 mark. Interestingly, we can also see how the tail of the distribution has increased by 22ms at the 95th percentile with an arrival mark of 3.917 seconds since the start of the slot. The increase in the block propagation times can be attributed to the data points coming from South America, whose tail distribution got delayed by almost 220ms. In line with our initial expectations, countries with more restricted access to hardware resources or internet bandwidth (South America and Africa) seem to be the ones taking the biggest hit in terms of block arrival awareness.
The following graphs show the CDF of the block arrivals aggregated by the client type that submitted the data points. The graphs barely show any differences between the pre- and post- Pectra upgrade. The only client that presents minimal differences is Prysm, which reported a mean block arrival time 120ms sooner than before the upgrade, and which, together with Teku, seems to be aware of blocks before the rest of the clients. Although we need to take this with a grain of salt, we should take these graphs as a performance comparison between CL clients (check out the disclaimer note below the charts).
Before Pectra:

After Pectra:

DISCLAIMER:The are a few reasons that should prevent us from taking these CL clients numbers as a performance comparison:
The figures above give us a wide overall view of the pre- and post-hardfork network status. However, they could be hiding sudden spikes or performance drops during specific epochs, i.e., the hardfork transition. To address this, the following charts display the same aggregated block arrival times and aggregations, but in a time series format.
The following graph shows what we think are the four most relevant data points over time: the minimum, the mean, the median, and the 95th percentile of the reported block arrival times. The figure shows stable block propagation over the network, with just a sudden spike of the 95th percentile line reaching the 4.6 seconds mark 12 hours before the hard fork on May 7th at 00 AM UTC (the hardfork took place at 10am UTC on May 7th). The spike lasted for a few hours before recovering and eventually lowering the mean and median arrival times to ~2.2 seconds from a former average of 2.38 seconds.
We attribute the spike of block arrivals around the hardfork time to some of the late-updating nodes that could indeed interfere with the mesh stability.

Once again, we observe that there are still 5% of block arrivals close to or even exceeding the 4-second mark, which should be alarming for MEV builders, but also individual builders with regard to the bids they accept.
The next graph aggregates the mean block arrival time by continent, where we can see quite a few different spikes:

The next graph shows the same time distribution but aggregating the block arrivals by the mean per client. The graph shows similar block arrivals to the pre-Pectra era, although most of them show performance improvement:

DISCLAIMER:
Check the previous disclaimer around the aggregated distributions for the different CL clients here.
One of the main concerns of the Pectra upgrade was how the network would react to a 50% increase in the blob target and max values. More precisely, whether it would resist that increase in bandwidth throughput, and if it would still be ready to keep pushing the limits (EthPandaOps post, ProbeLab post). This last chapter of the study presents the results from the upload bandwidth throughput measurements that ProbeLab carried out during the hardfork.
The following graphs show the CDF of the measured upload throughput for nodes in the Ethereum mainnet network when requested for a list of the latest 20 blocks from four different geographic locations. The first graph shows the measured distribution before the Pectra upgrade, and the one below the measurements after the Pectra upgrade.
Interestingly, when comparing both graphs, what we see is that the network didn’t experience any alarming changes in the bandwidth throughput distributions. However, we do see a small reduction in the available throughput for the lower half of the distribution (1st to 50th percentiles).
On a general note, we’ve observed a reduction of 1 Mbps for both the 10th and the 50th percentiles, which shifted from averages of 9.94 and 24.78 Mbps to 8.84 and 23.53 Mbps for home and cloud deployments, respectively. This reduction seems to be more present in the US West and Southeast Asia regions.
There is still some good news, though. The upper percentiles of the distribution showed bigger throughput beyond the mean, increasing the 75th and 90th percentiles from 37.22 and 61.46 Mbps to 40.26 and 82.12 Mbps, for home and cloud deployments r espectively.
Before Pectra:

After Pectra:

If we display the distribution based on the location of the remote node, we get the following graphs.
Before Pectra:

After Pectra:

Thanks to the data we gather from Nebula, we can identify the host type of the probed nodes, aggregating the measurements by those nodes hosted in cloud servers and those that we couldn’t correlate to any major data centre.
The following graphs show that the distributions didn’t change much in either case. The only perceived change corresponds to a variation of the steepness of the 30th percentile of the nodes hosted at cloud services, which has been slightly degraded by 1 Mbps. Either way, in both cases, the tail of the distribution shows the increment in throughput beyond the median, indicating that nodes were able to reply sooner with the whole set of requested blocks.
Before Pectra:

After Pectra:

Plain throughput is not the only thing that we are looking for; at least in Ethereum, the timings are relevant. Since the network has specific time windows, it is important to see when that throughput is available within the slot. The following graphs show the mean measured throughput aggregated by host type and the slot time at which the beacon blocks were requested.
The pattern is clear, there is a drop in both cloud and non-cloud hosted nodes between the first and the fourth second of the slot. This is the window when the network broadcasts the beacon blocks and the blob sidecars over gossipsub.
When it comes to comparing the pre- and the the post-Pectra upgrade distributions, what we see is that both follow the exact same pattern over the slot. The only difference, in this case, is that the mean has increased by 5-6Mbps for cloud nodes and 2Mbps for non-cloud nodes.
Before Pectra:

After Pectra:

IDONTWANT message primitive, but its influence in terms of bandwidth availability is not clear across the spectrum of node resource availability.The fork event highlighted a tendency among node operators to wait until the last minute to upgrade. While the majority of nodes followed the new fork on time, a significant portion lagged by up to a week. Compatible client releases were being adopted only gradually ahead of the fork, indicating that upgrade urgency is still lacking across parts of the network.
On the propagation side, timely block delivery still isn’t guaranteed. Around 5% of blocks arrive late at control nodes, and while median timings improved, the tail continues to struggle—pointing to persistent gaps in resource availability or network performance.
Still, the network overall remains in a stable and healthy state post-fork. The addition of extra blobs has not caused major disruption and the introduction of IDONTWANTs has improved the situation, but not significantly. Some nodes appear to have more bandwidth availability, possibly due to the IDONTWANT addition, or provision of extra bandwidth resources, while less powerful nodes (likely home stakers) present a slight reduction in terms of upload throughput.